Question 31993MathematicsJAMB
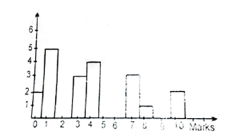
The bar chart below shows the distribution of marks in a class test. How many students took the test?
A
15
B
20
C
25
D
50
Step-by-Step Explanation
To determine the total number of students who took the test, sum the values represented by each bar in the chart. Each bar corresponds to a specific range of marks and indicates the number of students within that range. Adding these values together provides the total count of students who participated in the test.